How PriceBeam Works
PriceBeam is a pricing optimization as a service platform. Industry-agnostic, running studies in 127 countries worldwide to provide scientific and precise insights into what prices should be.

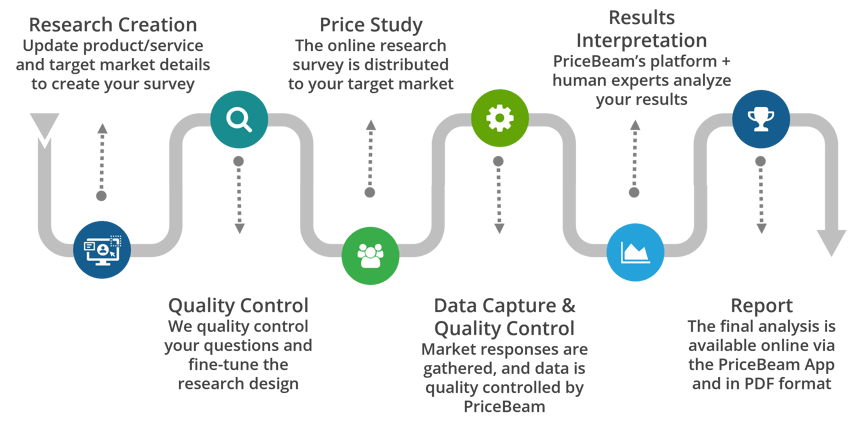
Step 1: Research Creation
Logging in to your account, you can create a project. With a project, we mean one survey to measure willingness to pay for one product or service. You can create as many projects as you need.
Once you created a project, you select which audience you need for the project. This means that you specify from our selection list the profile of the individuals you want to query about their willingness to pay and buy your product or service.
.png)
Step 2: Quality Control
Your information will generate a survey that will be sent to the audience you selected. Before the survey is launched, it is quality controlled by PriceBeam staff. If we find issues we cannot correct ourselves, we will contact you for further information.
.png)
Step 3: Market Research
The survey is launched and once we reach a statistically valid number of respondents, we will close the survey and analyze the data.
You will be notified of the survey launch, the survey completion and the progress at any point in time by logging on to your account. The survey and analysis process take about a week.
.png)
Step 4: Data Collection & Quality Control
Data is collected continuously and once all in, a PriceBeam team member will quality control the data.
We also apply an AI engine to further check that responses appear realistic and proper.
.png?width=1080&height=1080&name=Square%20Images%20%20(4).png)
Step 5: Results Interpretation
PriceBeam provides ready-to-use analysis and interpretation of the results, by providing a set of ready-made analyses.
Optionally, we can also provide human commentary and analysis about the data, and help create actionable conclusions.
.png)
Step 6: Analysis & Reporting
The Results will include:
The response to your questions.
Graphs to represent a measure willingness-to-pay for all respondents and for the segments you defined.
Graphs represent modeled revenue for all respondents.
Precise advice on price for the highest sales volume and highest revenue.
.png?width=1080&height=1080&name=Square%20Images%20%20(2).png)
.png?width=400&height=100&name=PBLogoTransparent%20(1).png)

